I recently had a need to visualize some network connections and thought there were probably plenty of existing tools to draw me a picture based on data in a CSV file since Sguil can export query results to a CSV. MySQL can also output to a CSV file, so the following could be scripted even more easily on a sguild server than a client. The client requires more manual steps, but I decided to try it that way first. C.S. Lee recommended trying afterglow. Looking at his blog, I saw that he had a short write-up on afterglow. I followed similar steps to install everything that was needed.
$ sudo apt-get install libgraphviz-perl libtext-csv-perlNext, I downloaded the afterglow source and extracted it.
Reading package lists... Done
Building dependency tree
Reading state information... Done
The following extra packages will be installed:
graphviz libio-pty-perl libipc-run-perl
libparse-recdescent-perl
libversion-perl libxml-twig-perl
Suggested packages:
graphviz-doc msttcorefonts libunicode-map8-perl
libunicode-string-perl
xml-twig-tools
Recommended packages:
libtie-ixhash-perl libxml-xpath-perl
The following NEW packages will be installed:
graphviz libgraphviz-perl libio-pty-perl libipc-run-perl
libparse-recdescent-perl libversion-perl libxml-twig-perl
libtext-csv-perl
$ tar xvzf afterglow-1.5.9.tar.gz
 For these examples, I connected to the Sguil demo server and exported one sancp query result. Afterglow expects three columns, which include the source IP, destination IP, and destination port. This is where running queries on the sguild server could make more sense since I could just select src_ip, dst_ip and dst_port and write the results to a CSV file. With results from the Sguil client, I have to take the CSV and remove everything but the desired columns.
To remove the other columns, I used sed. Perl or awk would work fine, too, and it is pretty easy to script. Here is an example I used without scripting. I am writing to a new file so I keep the original file intact. If you exported from Sguil and included the column names on the first line, the following command will delete the first and last lines to clean up the data before removing the extra columns.
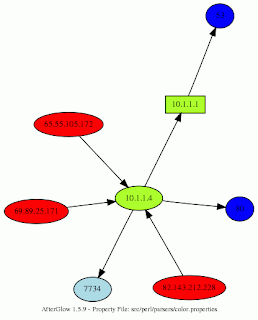
$ sed '1d' sancpquery_1.csv | sed 's/^\([^,]*,[^,]*,[^,]*,[^,]*,\)\([^,]*,\)\([^,]*,\)With a CSV exported from the results of a sancp query, that will leave you with the required three columns. Next, from the directory where I extracted afterglow, I can feed it the CSV. The results are using different values for "-p", zero being the default. Values of "-p 1" and "-p 3" made identical images.
\([^,]*,[^,]*\)\(,[^,]*,[^,]*,[^,]*,[^,]*\)/\2\4/' > sancpquery_1_3col.csv
$ cat /home/nr/sancpquery_1_3col.csv | src/perl/graph/afterglow.pl -v -p 0 -e 1.5
-c src/perl/parsers/color.properties | neato -Tgif -o ~/sancpquery_p0.gif
 Afterglow is an interesting tool. I can definitely see how it could help when looking at data on a spreadsheet isn't enough to visualize where and systems were connecting and on which ports. I can definitely think of some more features that might be useful, like showing timestamps or time ranges on connections, or even animating the images to show a sequence of events, but adding features could also make it unnecessarily complex.
Nice bro!
ReplyDeleteI also tried myself before.. for Nepenthes.
Just came across this post after referenced in #snort-gui.
ReplyDeleteHave you noticed that p0 shows you at a glance relationships that may not otherwise be apparent, but with a loss of information (which of the two example ports did the three connecting systems connect to 10.1.1.4 on?), but without labeling the arrow (perhaps for less than some defaulted value ports), it's hard to see how to fix this...assuming it needs fixing!
Barry, I'm not sure it needs fixing other than using a different option. With the various choices, I think the idea is to offer enough flexibility to get the results that are most useful for a particular situation. I honestly haven't played with Afterglow much since this post, so if I do get a chance I will take a another look and try to offer something besides this non-answer. :)
ReplyDeleteFor others reading, it is worth pointing out a recent related project by another member of the Sguil community. EDV is a project to offer visualization with Sguil and Snort events using Afterglow.